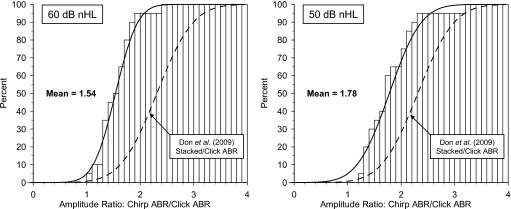
Figure 9.
Cumulative distribution of the ratios between the chirp and the click ABR amplitudes (N=20 ears) obtained at 60 dB nHL (left, mean value=1.54) and at 50 dB nHL (right, mean value=1.78). Both the observed distribution of the individual amplitude ratios and the corresponding continuous Gaussian distribution using the observed mean and standard deviation (Table 3) are shown. The continuous Gaussian distribution of the ratios between the modeled Stacked and the click ABR amplitudes obtained at 60 dB nHL by Don et al. 2009 [Fig. 1(c)] are shown for comparison (broken line).

