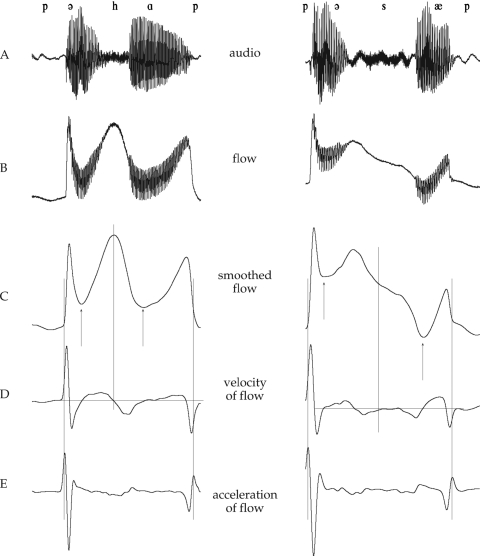
Figure 1.
Sample tokens of ∕pəhap∕ and ∕pəsæp∕ from a 5-year-old boy. The time axis is 500 ms for both sequences. (A). Audio signal. (B) Original airflow signal. (C) Smoothed airflow signal. The arrows show the region over which the final amplitude index was calculated (viz., between the flow minima of the two vowels). (D) Velocity of smoothed airflow. Zero-crossings in this signal were used to identify flow peaks in ∕h∕ and minima in ∕s z∕. (E) Acceleration of smoothed airflow. The peaks in this signal reflecting release and closure of the preceding and following ∕p∕s marked the boundaries of the FDA warping window.

