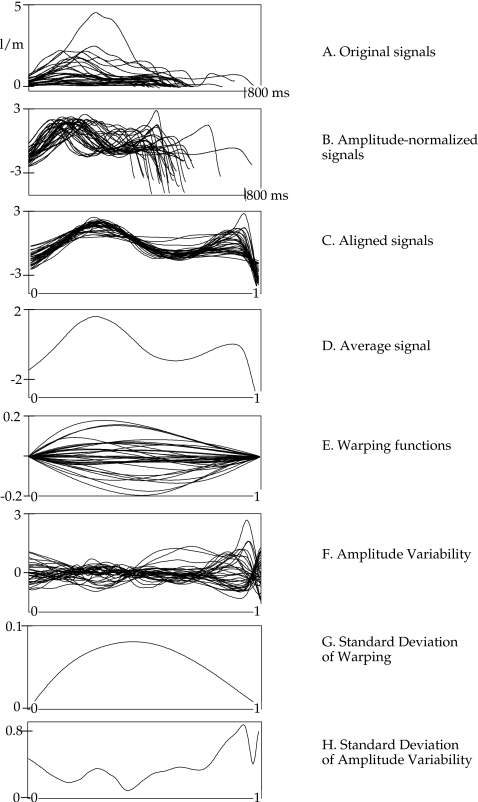
Figure 2.
An illustration of the processing steps for all tokens of ∕h∕ in speaker 5m1 (a 5-year-old boy). Panels top to bottom: (A) All original productions of ∕h∕ not normalized for time or amplitude. (B) Amplitude-normalized tokens. After amplitude normalization, the y-axis is unitless. (C) Time-normalized (i.e., aligned) tokens. After time normalization, the x-axis is unitless. (D) Average of all tokens after time and amplitude normalization. (E) Warping functions for all tokens. (F) Amplitude variability (SDs) for all original records relative to average. (G) SD of warping functions over normalized time. (H) SD of amplitude variability functions over normalized time.

