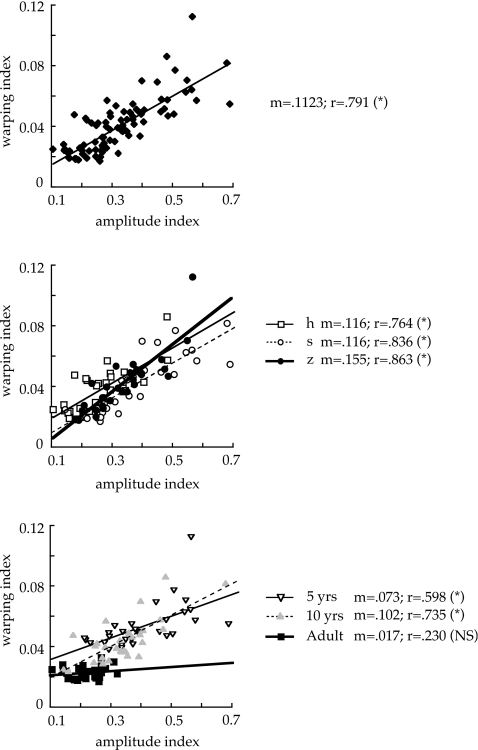
Figure 5.
Correlations between warping and amplitude indices for all data (top), the data split by consonant (middle), and the data split by speaker group (bottom). When split by consonant, open square, solid line represents ∕h∕; open circle, dotted line represents ∕s∕; and filled circle, heavy solid line represents ∕z∕. When split by age group, open triangle, solid line represents 5 year olds; gray triangle, dotted line represents 10 year olds; and filled square, heavy line represents adults. Asterisks after the r-values indicate that the correlation was significant at p<0.01; NS indicates that the correlation was not significant. As noted for Fig. 2, the scales are unitless.

