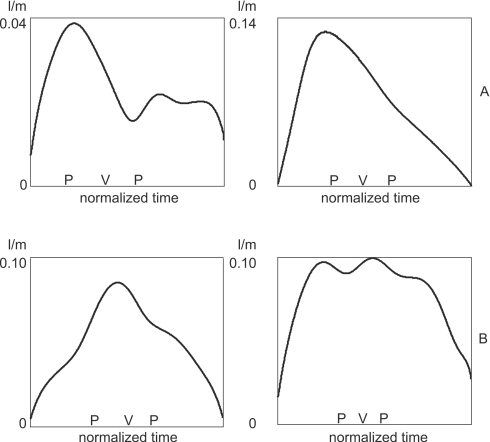
Figure 7.
Speaker differences in the location of maximum warping in ∕s∕. The P V P notations in each figure show the temporal location of the two peaks and the valley characteristic of airflow during ∕s∕. (A) Left: speaker AF7 (adult female); right: 10M3 (10-year-old male). (B) Left: speaker 5F6 (5-year-old female); right: 5M5 (5-year-old male). In all graphs, the x-axis is normalized time over the range of 0–1.

