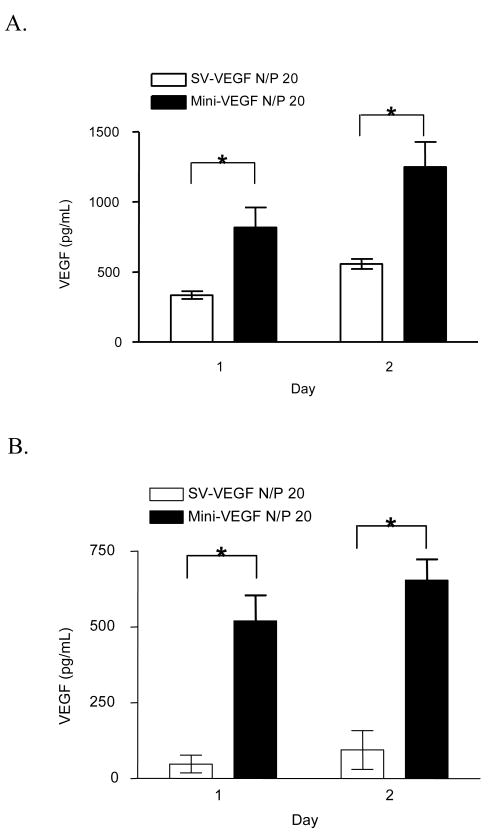
Figure 3.
VEGF gene expression after transfecting skeletal muscle cells with pMini-SV-VEGF or pSV-VEGF. The comparison was performed by using 1 μg pSV-VEGF or 0.25 μg pMini-SV-VEGF combining with 0.75 μg pGL3-basic (empty plasmid) on 4 × 10⁴ cells per well. (A) L8 rat skeletal muscle cell. (B) C2C12 mouse skeletal muscle cell. Data represents the mean ± SEM (n = 3). Statistical analysis was done using Student's t-test. * p<0.05 compared to pSV-VEGF.

