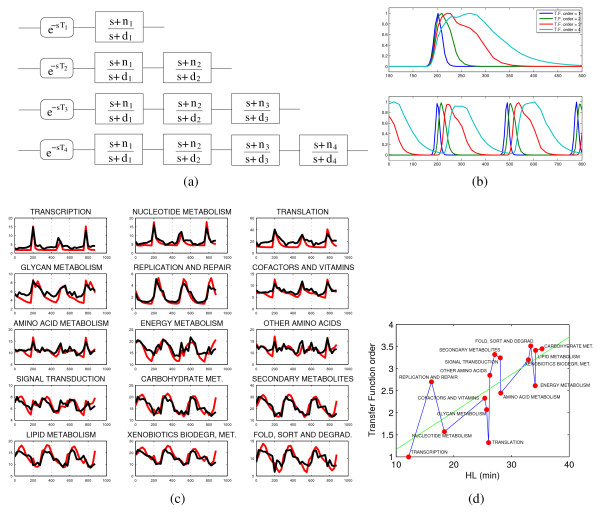
Figure 5.
Dynamical model of the response to a sequence of transcriptional pulses. Dynamically, the response of the system to the sharp pulses of transcriptional activation can be modeled in terms of input-output transfer functions (i.e., convolution integrals in the Laplace domain, see Methods for details). The main feature of a simple zero-pole transfer function with low-pass characteristic is that in correspondence of an impulse-like input it yields an output which is a smoothed and broadened version of the input. Concatenations of such zero-pole transfer functions describe accurately the progressive broadening and delaying of the YMC gene expression time series. Typical time profiles obtained for transfer functions of order 1 to 4 sketched in (a) are shown in (b). The top plot in (b) shows the larger kernels obtained by concatenating up to 4 first order transfer function blocks. The lower plot in (b) shows how consecutive impulse responses look like for the various orders of transfer functions and an extra delay element as in eq. (4). A simple fitting of the ni, di and Ti parameters and of the best model order for each gene allows to accurately reconstruct the average profiles for the 15 macrocategories of Fig. 2 (in (c) the model-based time courses are shown in red). With the usual exception of the category "translation", the best transfer function order is roughly proportional to the corresponding HL values, coherently with the other variables discussed in the paper.

