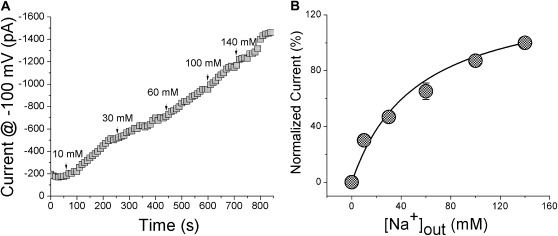
Figure 8.
Na+ affinity of native cation channels in M9K cells. (A) Typical traces recorded in the presence of varying concentrations of extracellular Na+ ions. (B) Dependence of AS currents on bath Na+ concentration ([Na+]out). Normalized currents were computed by dividing currents at D100 mV at the indicated [Na+]out by the corresponding value at 140 mM Na+; n = 4. Solid line: the raw data were fitted with the Michaelis-Menten equation (Km: 52.85 ± 11.47 mM).

