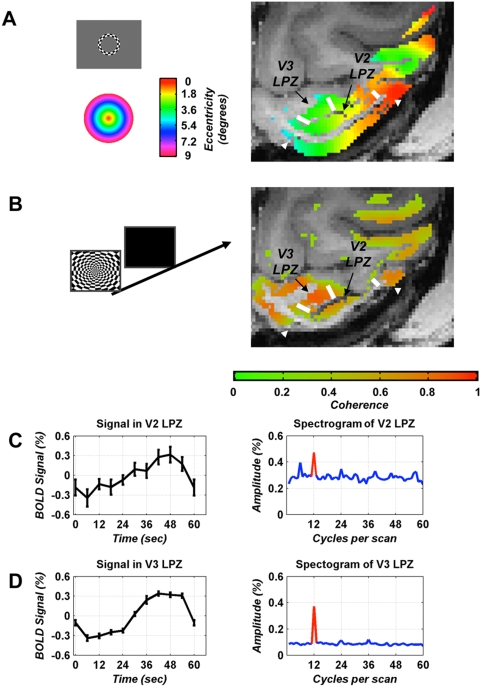
Figure 2. Visually elicited activation of the lesion projection zones (LPZ) in areas V2 and V3.
A In a pre-lesion experiment, an expanding ring checkerboard stimulus (see Materials and Methods, gray inset) was used to obtain an eccentricity map of macaque visual cortex. Voxels within gray matter whose coherence was at least one standard deviation above noise level (coherence >0.5, see Materials and Methods) were color-coded according to the stimulus eccentricity that elicited the BOLD response (colored inset) and overlaid on anatomical images acquired after lesioning V1. An axial MR-slice through the early visual cortex of macaque L02 is shown here. For display purposes, the functional data were spatially smoothed with a 2D-Gaussian filter (FWHM = 2 mm), but this was not used in the analysis and does not affect the results. White arrowheads mark the border of the V1 lesion as seen on the anatomical scan. White bars mark the borders of the area V2, V3 LPZs. There is strong and retinotopically organized visually driven activity throughout areas V1, V2, V3 prior to the lesion. B To measure functional activation in the LPZ after lesioning V1, a full-field rotating checkerboard pattern alternating with periods of background illumination was used (data from monkey L02 obtained 188 days post-lesioning). Data display conventions are as in A, except now it is the value of the MR coherence measure that is color coded and overlaid on the anatomical slice. As expected, the area corresponding to the anatomical V1 lesion, outlined by the white arrowheads, is devoid of significant functional activation. However, surprisingly, visually driven activity is seen to persist inside the LPZs of both area V2 and V3. C Mean percent BOLD signal modulation (left) and mean amplitude spectrogram (right) over all voxels inside the area V2 LPZ. The stimulation frequency is displayed in red (12 cycles). Note that there is a significant stimulus driven BOLD modulation (∼0.6% peak to peak amplitude, z-score = 7.0). D Similar to C for the V3 LPZ (z-score = 33.3).

