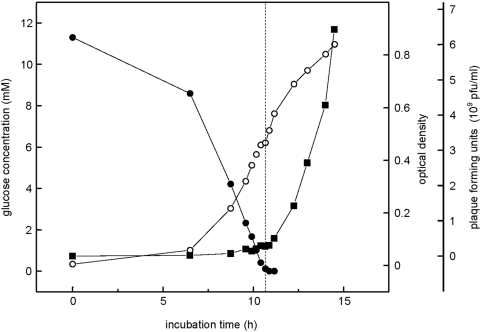
Figure 8. Correlation of increased release of active bacteriophage with carbon starvation.
Aggregates and aggregate dispersion after glucose depletion (dashed line) was monitored by OD (open circle) and glucose determination (solid circle), and the release of active bacteriophage into the culture supernatant (square) determined as plaque formation units (pfu) after drop-plating serial dilutions of cell-free culture supernatant onto soft-agar plates with P. aeruginosa PAO1 ΔPf4 lawn, indicative of infective phage production.

