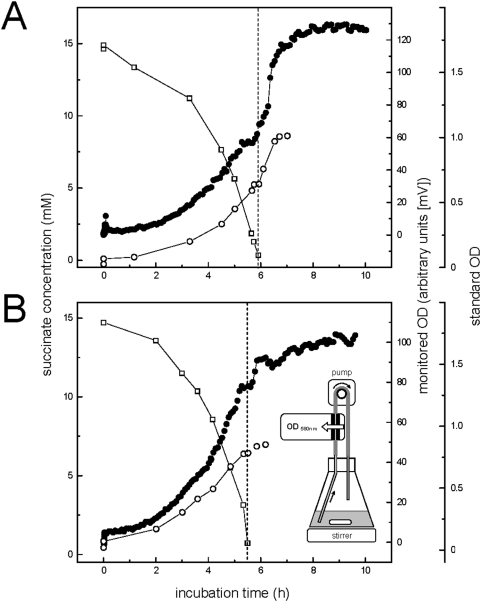
Figure 9. Detailed growth curves established by automated OD determination.
The OD in identically incubated batch cultures of aggregating Pseudomonas aeruginosa PAO1 (panel A), and of non-aggregating strain Comamonas testosteroni KF-1 [42] for comparison (panel B), were monitored in 10-min intervals (solid circles) in a flow-through OD photometric system (see inset in panel B). At longer time intervals, growth was also followed by manual sampling and determination of standard OD (open circles) and carbon substrate concentration (open squares; succinate). Time points of starvation are indicated by dashed lines.

