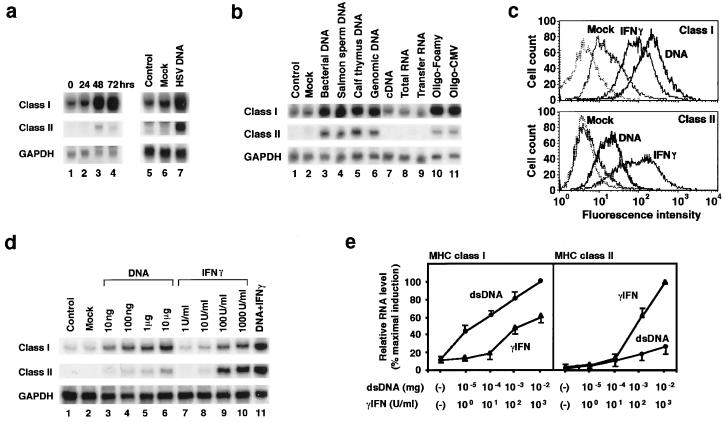
Figure 1.
DNA induces MHC expression in cells. FRTL-5 cells (2 × 10⁶ cells in 10-cm dishes) were infected with HSV (a, lanes 1–4; ref, 29), or, alternatively, they were transfected with 5 μg of HSV DNA fragments (a, lane 7), the indicated DNAs (b, lanes 3–7), RNA (b, lanes 8 and 9), or the following 54-bp ds oligodeoxynucleotides (ODNs) from Foamy virus or cytomegalovirus (CMV; b, lanes 10 and 11): CATCTTCCAGTTCATCTCTAGTCATTTGGGCTGTTTCGGCCATTGTTACTGGTC and CTATTTGCACCACGTTCGCAGCCATACCAATCTACCTGATCCCATCTCCAGGCT, respectively. GAPDH = glyceraldehyde-3-phosphate dehydrogenase. (c) Fluorescence-activated cell sorter analysis of cell-surface MHC class I and class II expression induced by DNA or 100 units/ml rat γIFN 48 h after treatment. Cells were transfected with 5 μg of pcDNA3 (Invitrogen), exactly as they were for all dsDNAs in a and b. The dashed line represents control staining with fluorescein isothiocyanate-labeled normal mouse IgG1. The data shown in a, b, and c are typical results from three experiments performed on different batches of cells. (d and e) Cells were transfected with the indicated amounts of dsDNA (d, lanes 3–6), treated with γIFN (d, lanes 7–10), or exposed to both (d, lane 11). d depicts Northern blotting from one representative experiment; e presents the mean ± SD from four separate experiments expressed relative to the maximum induction of class I RNA (Left) or the maximum induction of class II RNA by γIFN (Right). (a–e) The total RNA was prepared, and Northern analysis was performed at the times noted or 48 h after treatment. Lipofectamine treatment alone served as a control transfection procedure (Mock).

