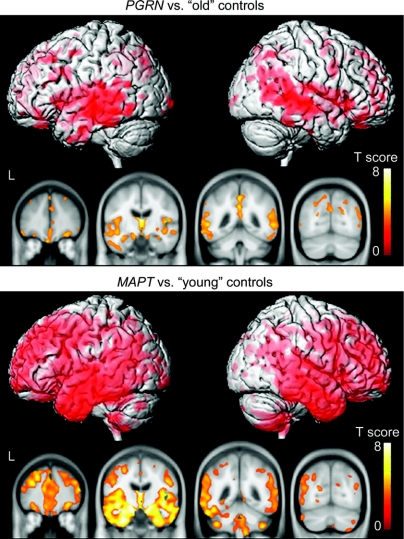
Figure 2 Patterns of gray matter loss in subjects with mutations in PGRN compared to age-matched old controls, and subjects with mutations in MAPT compared to age-matched young controls
Results are shown on three-dimensional renders of the brain and coronal slices through the frontal, temporal, and parietal lobes.

