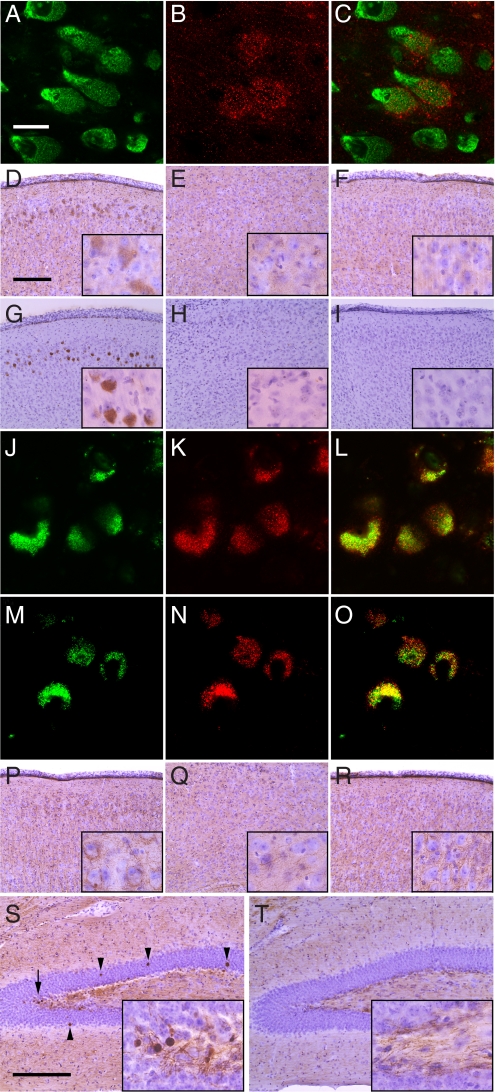
Fig. 1.
Lysozyme and P-tau in Naglu−/− and control mouse brain. (A–C) Confocal images of cells in MEC of Naglu−/− mouse brain stained with (A) NeuroTrace, a marker for neurons, (B) with antibody against lysozyme, (C) merged images of A and B. (Scale bar, 20 μm.) (D–F) Immunohistochemistry with lysozyme antibody of (D) Naglu−/− MEC, (E) Naglu−/− LEC, and (F) Naglu+/− MEC. (Scale bar, 200 μm.). Insets are at 4 times higher magnification. (G–I) Immunohistochemistry with P-tau antibody AT100 of (G) Naglu−/− MEC, (H) Naglu−/− LEC, and (I) Naglu+/− MEC. (Scale as in D.) (J–L) Confocal images of neurons in Naglu−/− MEC immunostained with (J) P-tau antibody AT100, (K) lysozyme antibody, and (L) merged image of J and K. (Scale as in A.) (M–O) Confocal images of Naglu−/− neurons immunostained with (M) P-tau antibody AT100, (N) SCMAS antibody, and (O) merged image of M and N. (Scale as in A.) (P–R) Immunohistochemistry with P-tau antibody AT270 of (P) Naglu−/− MEC, (Q) Naglu−/− LEC, and (R) Naglu+/− MEC. (Scale as in D.) (S–T) Immunohistochemistry with P-tau antibody AT270 of dentate gyrus of (S) Naglu−/− mouse and (T) Naglu+/− mouse; arrowheads indicate round bodies, while the arrow indicates area shown in inset. (Scale bar, 200 μm.)

