
Figure 6. Comparison of the roles of Abf1, Reb1, and RSC in nucleosome positioning.
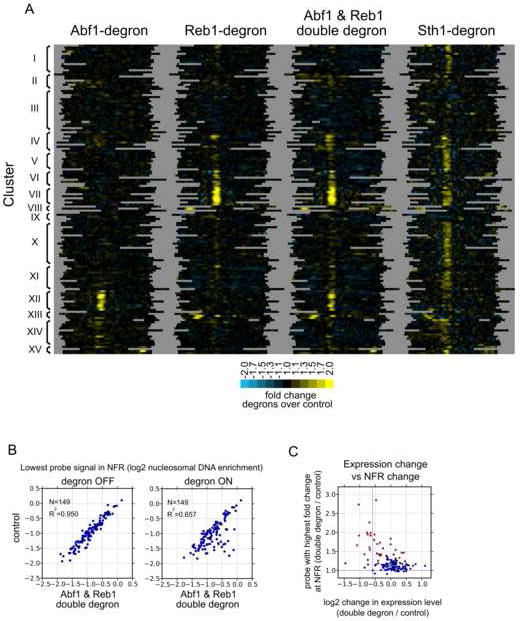
A. Clustering analysis of difference maps. Shown are difference maps for the indicated strains including the Abf1-Reb1 “double degron” strain. K-means (K=15) clustering was applied. Line traces of cluster averages are shown in Fig. S14.
B. Scatter plots of double degron. Analysis was performed as in Fig. 3C.
C. Gene expression analysis. Shown is the correlation between mRNA and NFR changes in cells depleted of both Reb1 and Abf1. The p-value (hypergeometric testing) of the significance of the enrichments in the group of genes (N=20) consisting of those affected in NFR size by Abf1-or Reb1-depletion (Cluster I in Fig. 3 and Cluster I in Fig. 4; corresponding points are colored red in this figure) using a 1.5-fold cutoff for decreases in mRNA levels was 1.2×10⁻⁶. The p value for the remaining, unaffected genes (N=123) was 0.99.