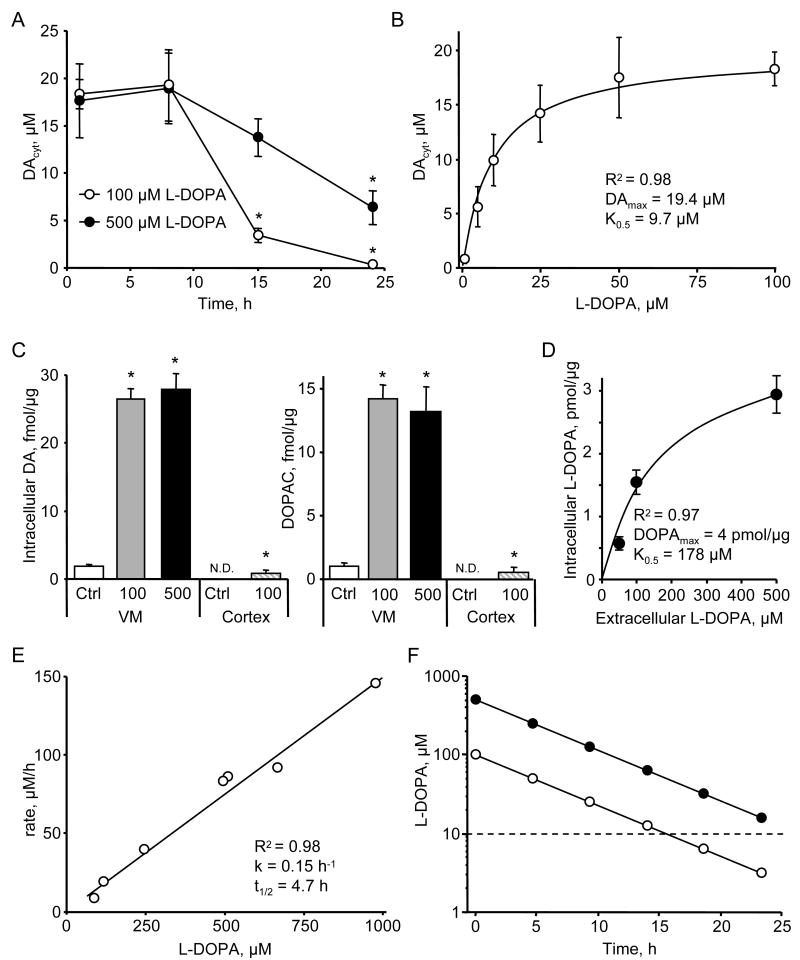
Figure 1. L-DOPA metabolic consumption by VM neurons.
(A) Time dependence of DAcyt following cell treatment with two L-DOPA concentrations. * - p<0.05 vs. 1h time-point by one-way ANOVA (n = 9-52 cells in different groups).
(B) Dependence of DAcyt on extracellular L-DOPA in mouse neurons treated with the drug for 1h (n = 10-24 cells). Solid line indicates the fit of the data-points using the equation: [DAcyt] = DAmax * [L-DOPA] / (K0.5 + [L-DOPA]).
(C) HPLC-EC measurements of the total intracellular DA and DOPAC in rat VM (n = 9 dishes) and cortical (n = 3) neuronal cultures exposed to 100 or 500 μM L-DOPA for 1h; N.D. is ‘not detected’. * - p<0.05 vs. untreated cultures.
(D) HPLC measurements of intracellular L-DOPA contents in rat VM cultures pretreated with AADC inhibitor benserazide (2 μM; 1 h) and then treated with 50, 100 or 500 μM L-DOPA for 1h (n = 3-8 dishes). Solid line indicates the fit of the data-points using the equation: [L-DOPAintracell] = DOPAmax * [L-DOPAextracell] / (K0.5 + [L-DOPAextracell]).
(E) Dependence of the rate of L-DOPA auto-oxidation on the initial L-DOPA concentration determined by HPLC-EC in cell-free system. The half-life was calculated from the incline (k) of the linear fit of the data-points as t1/2 = Ln(2)/k.
(F) Time dependence of extracellular L-DOPA concentration modeled using kinetic constants from (E). Dashed line indicates K0.5 from (B).
Data on panels A-D are means ± SEM.

