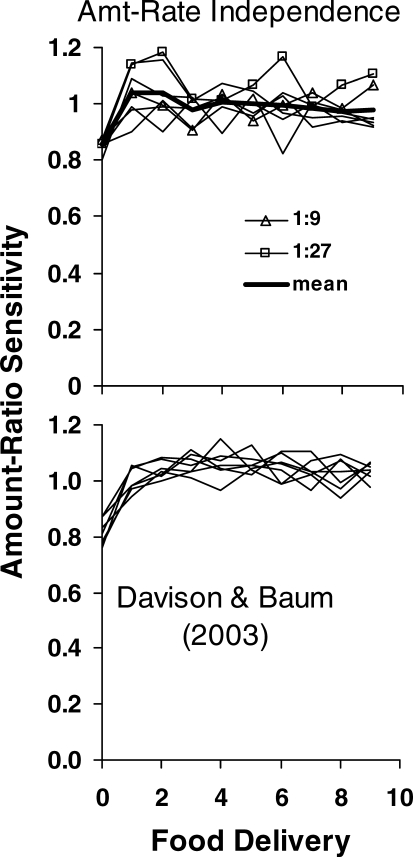
Fig 3.
Top: Sensitivity to food-amount ratio as a function of successive food deliveries. For each rate-ratio component and each food delivery within a component, Equation 1 was fitted to the three behavior ratios for the three amount ratios, across phases. The amount sensitivity was the slope of the fitted line. Each lighter line shows amount sensitivity for one rate ratio. Squares and triangles indicate the 1∶9 and 1∶27 rate ratios, and the heavy line shows the mean across components. Bottom: a similar analysis, done at our behest by Michael Davison, of the results from a similar experiment with pigeons. Each point represents the slope of Equation 1 fitted to seven behavior ratios for seven amount ratios. Each line represents amount sensitivity across food deliveries for one rate-ratio, within-session component.

