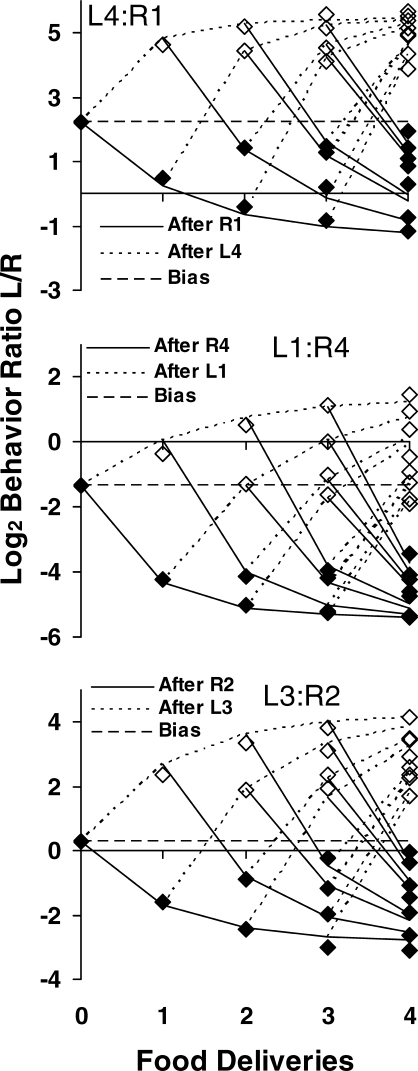
Fig 4.
Log (base 2) interfood behavior ratio (Left/Right) as a function of source sequence of food for the first four food deliveries within components. The broken horizontal line in each graph represents bias due to the amount difference, and the lines show the results of fitting Equation 3. The open symbols indicate choice following a food delivery from the left lever, and filled symbols choice following a food delivery from the right lever.

