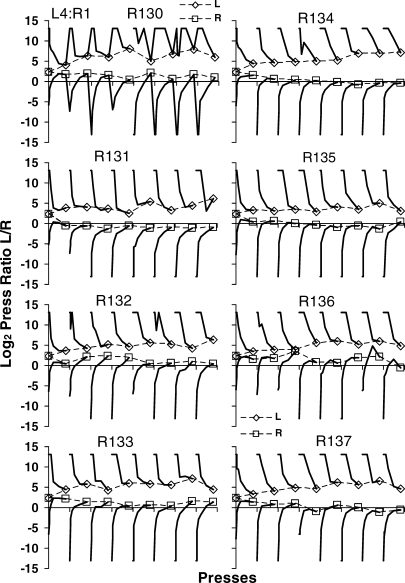
Fig A7.
Preference pulses following continuing food deliveries up to the eighth food delivery in components in the phase in which the left lever delivered four pellets and the right lever one pellet. Curves were constructed by calculating preference for press 1, presses 2 and 3, presses 4-7, presses 8-15, presses 16-31, presses 32-63, and presses 64-100. The symbols and lines show the final points of the curves. See text for more explanation.

