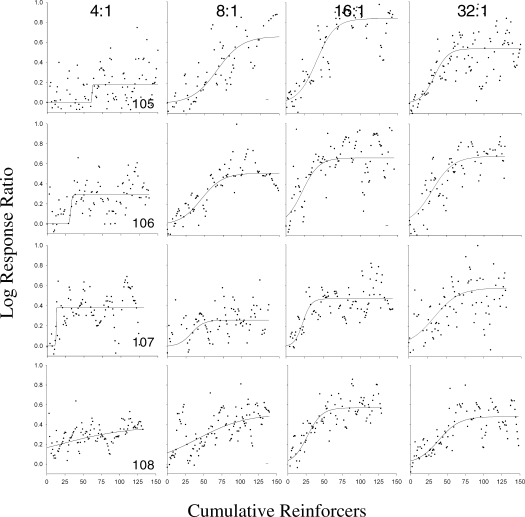
Fig 5.
Sample transitions for the other 4 animals at 4:1, 8:1, 16:1, and 32:1 magnitudes, reading from the left to the right columns. Each row represents a different subject. Data points are those calculated by the 9-point LOWESS smoothing algorithm. The curves are the best-fitting functions generated with the logistic equation.

