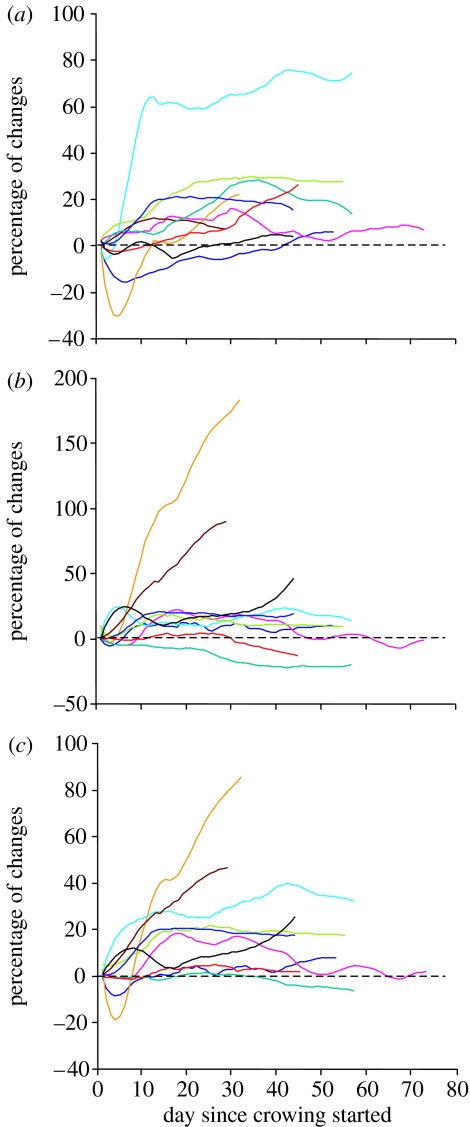
Figure 4.
Developmental trajectories of the duration of crows. Each colour indicates a different quail. (a) T13 (interval between the beginning of the crow and the beginning of the third syllable (final trill)). (b) S3: duration of the last syllable (trill) of the crow. (c) TD: total duration of the crow. Daily data were smoothed using a Savitzky–Golay (polynomial) smoothing filter (polynomial order: 3, frame size: 15). A dashed line indicates baseline value (zero): for each day, we subtracted the daily mean value of the first day of recording from the daily mean value of the day.

