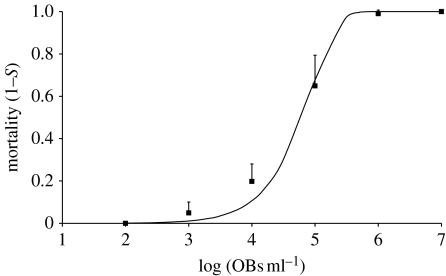
Figure 3.
Dose–response data for AcMNPV in S. exigua L3 larvae. On the x-axis is the occlusion body (OB) concentration per ml (log), and on the y-axis the mortality. Bioassay mortality data (squares), with the standard deviation, and the fitted dose–response relationship under IAH (curve) are displayed. See §2 for the number of replicates per concentration. Note that, for simplicity, OB concentration was taken as dose, rather than as an estimate of the number OBs or virions ingested.

