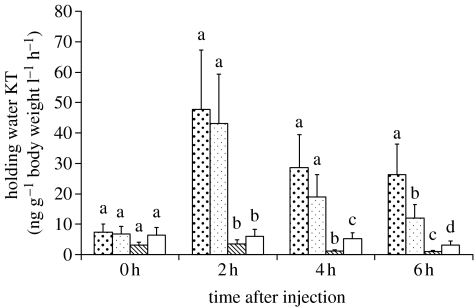
Figure 2.
Validation of the hormonal treatments. Levels of 11-KT in fish subjected to different intraperitoneal injection treatments: high dose (2 μg g−1 body weight) of KT (large dot bars); low dose (0.2 μg g−1 body weight) of KT (small dot bars); CA (1 mg g−1 body weight) (hatched bars); and saline solution (control, white bars). Different letters indicate significantly different groups (p<0.05) within each sampling point.

