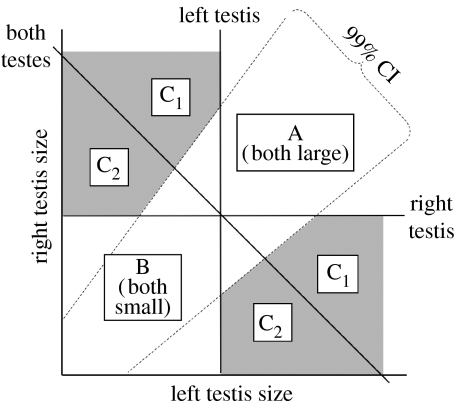
Figure 1.
Diagrammatic representation of the graphical approach used for determining the natural incidence and extent of testis compensation in wild birds. In a plot of right testis size against left testis size, males in area A have each testis larger than the population median size for that given side. By contrast, those in area B have both testes smaller than the population median. Any data point in the shaded area C indicates compensation: one testis is smaller, but the other is larger than the population median for the respective side. Upper and lower areas C refer to compensation achieved by the right or left gonad, respectively. For males showing compensation, if the combined size of both testes is equal or greater than the population median combined size, compensation is considered complete (area C1); otherwise compensation is partial (area C2). The dashed lines refer to the 99% confidence levels for the relationship between the left and right testis sizes and are used to differentiate considerable deviations from this relationship for a more conservative quantification of compensation incidence.

