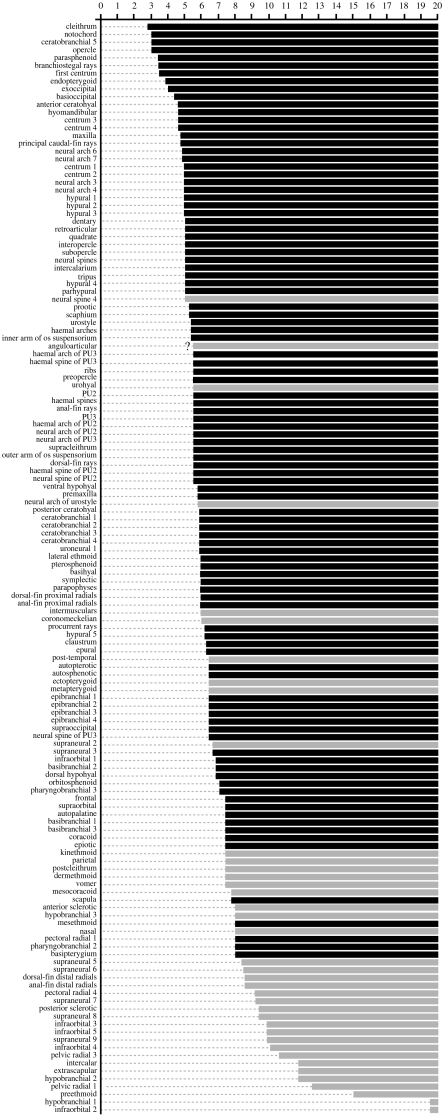
Figure 4.
Diagram to illustrate the relationship between sequence of ossification of D. rerio compiled from Cubbage & Mabee (1996) and Bird & Mabee (2003) and losses and reductions in the skeleton of adult D. dracula. Numbers along the top refer to sizes in millimetres at which ossifications appear in the zebrafish. Names of bones on the left side of the diagram are arranged in sequence of ossification in the zebrafish from top (earliest) to bottom (latest). First appearance of ossification in the zebrafish is shown as horizontal bars at given lengths. Black bars represent ossifications present and grey bars ossifications absent in D. dracula. No information was provided by above authors for pectoral radials 2 and 3, pelvic radial 2, middle radials of dorsal and anal fin and uroneural 2, which are all absent in D. dracula. Question mark at bar of the anguloarticular indicates lack of separate information for angular and articular in Cubbage & Mabee (1996).

