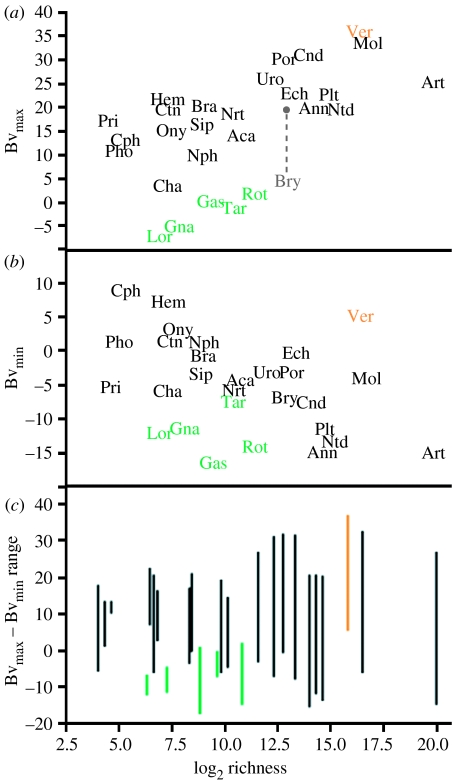
Figure 1.
The relationship between body size and species richness among metazoan phyla and subphyla. (a) Log2 biovolume of the largest species (Bvmax) of a taxon versus its log2 richness. (b) Log2 biovolume of the smallest species (Bvmin) of a taxon versus its log2 richness. (c) Range between the largest and smallest sized species (indicated by lines) versus log2 richness. Increased richness among metazoan phyla is correlated with an increase in maximum size, a decrease in minimum size and an increase in overall body size range. A group of outliers (green) represents phyla that occupy physically space-limited habitats. Vertebrates (Ver, orange) also have a greater minimum size than expected from their richness alone. Bryozoa (Bry, grey) is shown with both the largest autozoid size and the largest colony size (connected with grey line). Aca, Acanthocephala; Ann, Annelida; Art, Arthropoda; Bra, Brachipoda; Bry, Bryozoa; Cha, Chaetognatha; Cnd, Cnidaria; Cph, Cephalochordata; Ctn, Ctenophora; Ech, Echinodermata; Gas, Gastrotricha; Gna, Gnathostomulida; Hem, Hemichordata; Lor, Loricifera; Mol, Mollusca; Nph, Nematomorpha; Nrt, Nemertea; Ntd, Nematoda; Ony, Onychophora; Pho, Phoronida; Plt, Platyhelminthes; Por, Porifera; Pri, Priapula; Rot, Rotifera; Sip, Sipuncula; Tar, Tardigrada; Uro, Urochordata; Ver, Vertebrata.

