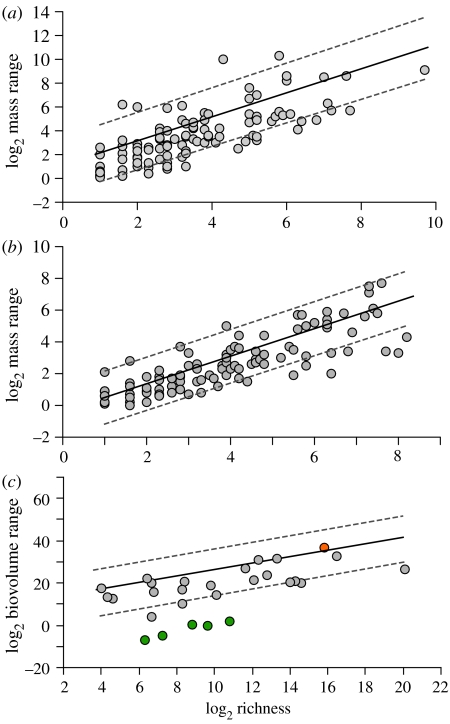
Figure 2.
Log2 body size range between the largest and smallest species versus log2 richness for (a) mammalian families (y=1.01x+1.14, r2=0.65, p<0.0001), (b) avian families (y=0.87x+0.37, r2=0.81, p<0.0001) and (c) metazoan phyla (y=1.52+11.16, r2=0.55, p<0.0001). Outliers (green) represent phyla that occupy physically space-limited habitats. The vertebrates are indicated in orange. Phylogenetically correct regression lines (ordinary least-square) with confidence intervals are plotted in the original data space following the methods of Garland & Ives (2000). As similar results were obtained from the two metazoan phylogenies, only results from the Orme tree are shown. Overall, body size range correlates strongly with richness among groups both at higher and lower levels of taxonomic organization.

