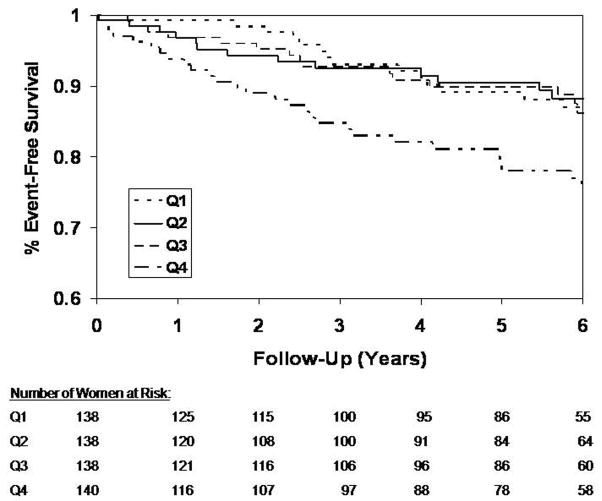
Figure 2.
Kaplan-Meier curves for freedom from cardiovascular events by TG/HDL-C quartile Quartile 1 (Q1) through Q4 correspond to the quartiles of TG/HDL-C as shown in Table I (Q1: 0.35-<1.4, Q2: 1.4-<2.2, Q3: 2.2-<3.66, Q4: 3.66–18.4). Excess risk of cardiovascular events is limited to individuals in Q4 of the TG/HDL-C distribution.

