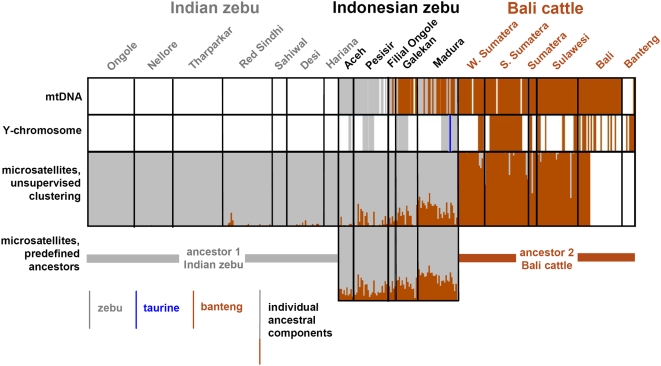
Figure 2. Genomic components of Indonesian cattle animals.
Animals are represented as vertical lines, the color of which indicates zebu of banteng mitochondrial DNA (top panel), zebu, taurine or banteng Y-chromosomal DNA (second panel, only for males), the proportion of the individual genomes derived from the two clusters identified by unsupervised model-based clustering (third panel) or from the proportions derived from two predefined clusters (Indian zebu and Bali cattle, bottom panel). Each animal is plotted in the respective panels at the same position. A white line indicates absence of data.

