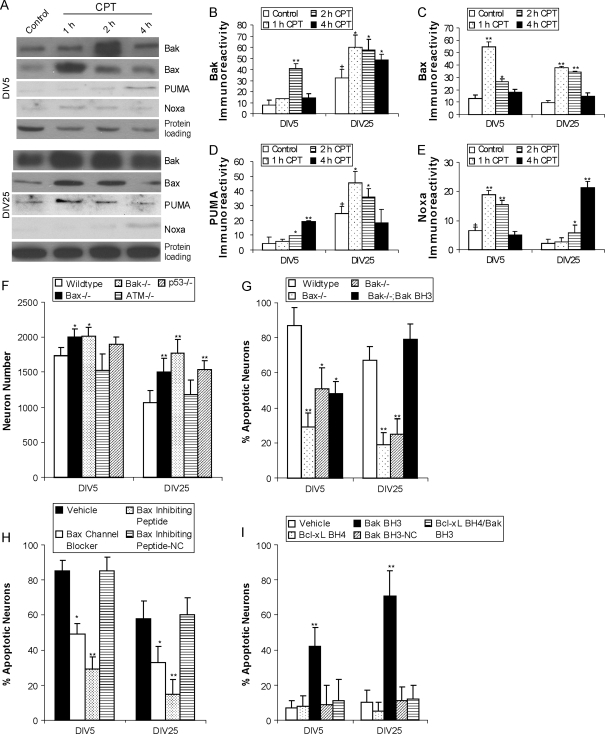
Figure 3.
Effectors of cell death downstream of p53 are regulated differentially and have different contributions in the mechanisms of apoptosis in immature and mature cortical neurons. (A) Western blots showing rapid changes in the levels of multidomain (Bax and Bak) and BH3-only (Noxa and Puma) cell death proteins with 10 μM CPT treatment for 1 through 4 h in DIV5 and DIV25 neurons. GAPDH blot shows protein loading. (B) Graph of Bak levels (in relative OD units) in DIV5 and DIV25 neurons with 10 μM CPT treatments for 1 through 4 h. Values are mean ± SD (n = 3 different cultures of 6 pooled 35 mm wells per data point). Symbols denote: significantly higher **P < 0.001 and *P < 0.01 versus age-matched vehicle-treated neurons; significantly greater +P < 0.01 versus DIV5 vehicle-treated neurons. (C) Graph of Bax levels (in relative OD units) in DIV5 and DIV25 neurons with 10 μM CPT treatments for 1 through 4 h. Values are mean ± SD (n = 3 different cultures of 6 pooled 35 mm wells per data point). Symbols denote: significantly higher **P < 0.001 and *P < 0.01 versus age-matched vehicle. (D) Graph of Puma levels (in relative OD units) in DIV5 and DIV25 neurons with 10 μM CPT treatments for 1 through 4 h. Values are mean ± SD (n = 3 different cultures of 6 pooled 35 mm wells per data point). Symbols denote: significantly higher **P < 0.01 and *P < 0.05 versus age-matched vehicle; significantly greater +P < 0.01 versus DIV5 vehicle-treated neurons. (E) Graph of Noxa levels (in relative OD units) in DIV5 and DIV25 neurons with 10 μM CPT treatments for 1 through 4 h. Values are mean ± SD (n = 3 different cultures of 6 pooled 35 mm wells per data point). Symbols denote: significantly higher **P < 0.001 and *P < 0.05 versus age-matched vehicle; significantly greater +P < 0.05 versus DIV25 vehicle-treated neurons. (F) Graph of the survival (neuron number/mm2) of genetically distinct mouse cortical neurons with homozygous deletion of Bax, Bak, ATM, or p53 genes compared with wild-type neurons. Neurons were plated at identical densities, maintained identically in culture, and then assessed for survival at DIV5 and DIV25 using phase contrast imaging. Values are mean ± SD based on at least 6 images per group and were replicated in 2 different culture experiments. Symbols denote: significantly higher *P < 0.05 and **P < 0.01 versus age-matched wild-type neurons. (G) Homozygous deletion of Bax or Bak genes protect against apoptosis in mouse cortical neurons treated with CPT for 24 h at DIV5 and DIV25. Apoptosis was reconstituted in Bak−/− mouse cortical neurons by treatment (20 μM) with a cell-permeable Bak-BH3 domain peptide. Mutated Bak-BH3 peptide (negative control, NC) had no apoptotic activity in cortical neurons (see panel I). Values are mean ± SD based on at least 6 images of Hoechst-stained neurons per group and were replicated in 3 different culture experiments. Symbols denote: significantly lower **P < 0.001 and *P < 0.01 versus wild-type neurons. (H) Neuroprotection in wild-type mouse cortical neurons by pharmacological manipulation of Bax function. Pretreatment (20 μM) of DIV5 and DIV25 cortical neurons with a cell-permeable Bax-channel blocker (dibromocarbazole-piperazinyl derivative) or a Bax-inhibiting pentapeptide derived from the Ku70-Bax inhibiting domain effectively blocks CPT-induced apoptosis. A mutated analog of Bax-inhibiting pentapeptide did not block apoptosis of cortical neurons. Values are mean ± SD based on at least 6 images of Hoechst-stained neurons per group and were replicated in 3 different culture experiments. Symbols denote: significantly lower **P < 0.001 and *P < 0.01 versus vehicle-treated neurons exposed to 10 μM CPT. (I) Neuroprotection in wild-type mouse cortical neurons using an antiapoptotic BH4 domain peptide. Pretreatment (10 μM) with a peptide containing the Bcl-XL-BH4 domain linked to a 10 amino acid HIV-TAT carrier peptide (Bcl-XL-BH4 peptide) completely blocked Bak-BH3 peptide-induced (20 μM) apoptosis. Values are mean ± SD based on at least 6 images of Hoechst-stained neurons per group and were replicated in 3 different culture experiments. Symbols denote: significantly higher **P < 0.001 than all other treatment groups.

