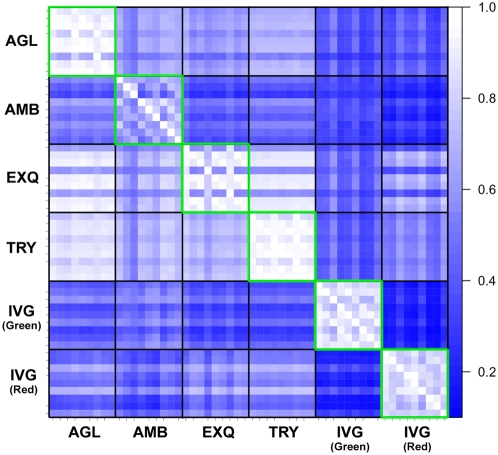
Figure 5. Agreement in the list of differentially expressed microRNAs.
This graph indicates the concordance of microRNAs identified as differentially expressed for pairs of platforms, labeled as X and Y. A list of differentially expressed microRNAs between human liver vs. human prostate was generated for each platform (using the 309 common microRNAs with ≥two-fold change) and compared for commonality to other platforms. No filtering related to the qualitative detection call was performed. The color of the square in the matrix reflects the percent overlap of microRNAs on the list for the platform X (listed in column) that are also present on the list for the platform Y (listed in row). A light-colored square indicates a high percent overlap between the microRNA lists at both platforms. A dark-colored square indicates a low percent overlap, suggesting that most microRNAs identified in platform X were not identified in platform Y. Note: the graph is asymmetric and not complementary, for the same reason as in Figure 4B and C.

