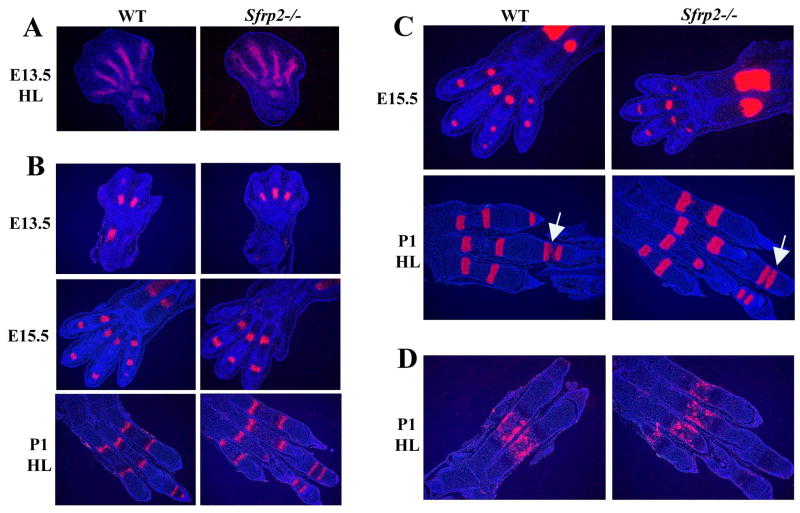
Figure 5.
mRNA in situ hybridization analysis of mesenchymal, cartilage and bone differentiation markers at E13.5, E15.5 and newborn (P1) stage (HL= hindlimb). (A) Sox9 and (B) Indian hedgehog antisense probes show comparable pattern of expression between Sfrp2-/- and WT controls. (C) Type X collagen is normally expressed, however the probe detected a delay in chondrocyte differentiation of Sfrp2-/- mice demonstrated by the smaller distance between the hypertrophic zones in the metaphyses of the first phalanx at P1 (arrows). (D) The antisense probe specific for Osteocalcin shows no overt difference at P1 between the two genotypes.

