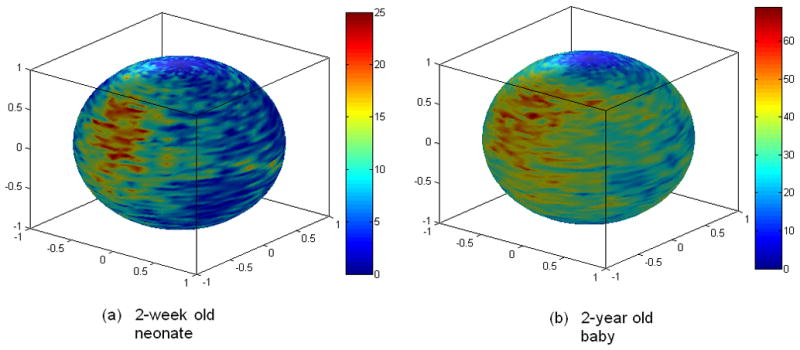
Fig. 1.

Examples of fiber distribution patterns in a neonate (a) and a 2-year old baby (b) are shown. Fiber orientations are obtained using voxels with a FA larger than 0.3 in the 2-week old neonate and 0.4 in the 2-year old baby based on a 6 direction DTI experiment and visualized on a sphere representing the 3D directions. Color codes represent number of fibers in a specific orientation block (4° span in azimuth angle and 2° span in elevation angle).
