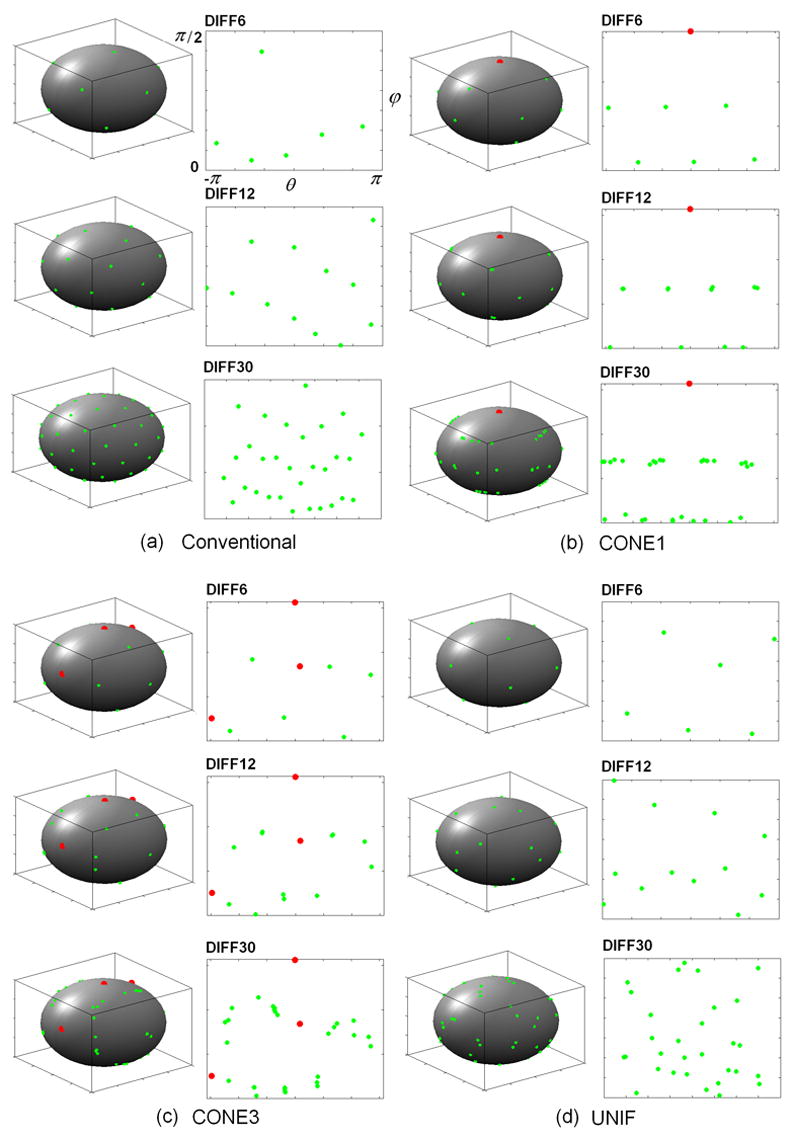
Fig. 6.

Diffusion gradient orientations are shown for the conventional scheme (a) and the proposed optimization scheme in CONE1 (b), CONE3 (c) and UNIF (d), respectively. Red points represent the center directions of the predefined fiber distributions (CONE1 and CONE2). Green points are the orientations of the diffusion gradients. In each panel, the diffusion gradient directions are plotted on a spherical coordinate with azimuth angle θ (X-axis) ranging from −π to π and elevation angle ϕ(Y-axis) from 0 to π/2.
