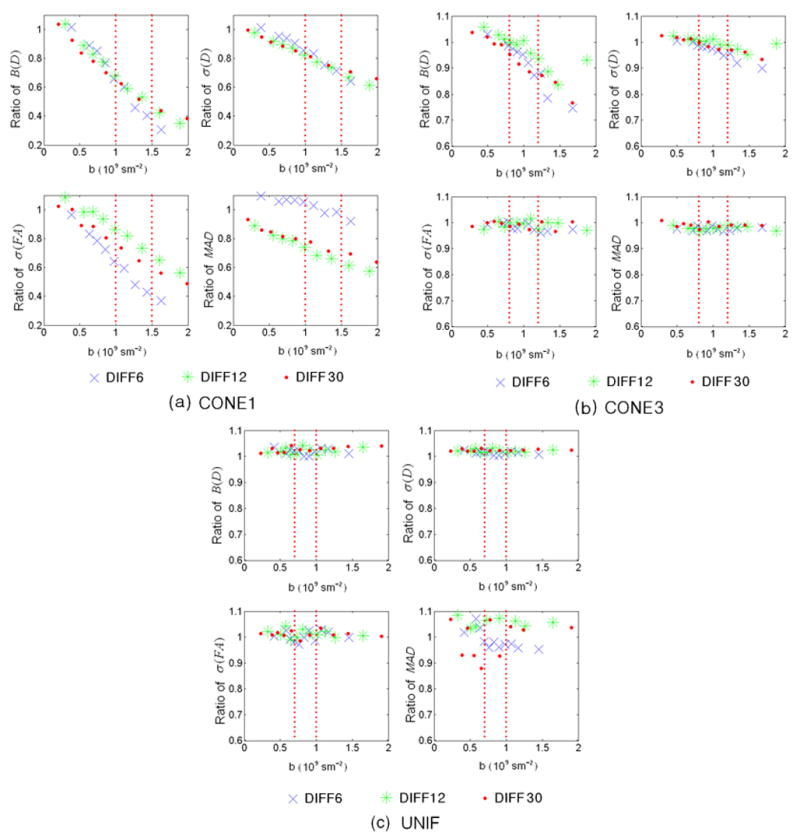
Fig. 7.

Improvement ratios of the four performance indices are shown for CONE1 (a), CONE3, and UNIF (c), respectively, where P0=450. X-axis represents b-value in 109s/m2 and Y-axis represents the performance indices values. Dashed red lines indicate the rages of optimal b-value using the proposed optimization approach. Blue crosses, green asterisks, and red filled circles represent DIFF6, DIFF12, and DIFF30, respectively.
