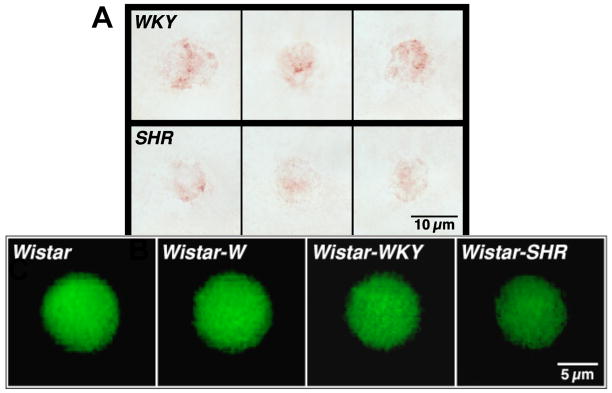
Figure 6. Extracellular Insulin Receptor Cleavage and Insulin Resistance.
Panel A: Typical micrographs of immunolabel (Vector NovaRed) for the extracellular domain binding site of the insulin receptor α on fresh leukocytes (neutrophils and monocytes) from WKY and SHR. Note the reduced density of the insulin binding sites on the SHR leukocytes associated with about 20% average reduction of the receptor density on the plasma membrane and with reduced transport of glucose (shown with fluorescence-tagged analog of glucose in panel B) into the cell cytoplasm (25). Panel C: Glucose transport into naïve leukocytes from the normotensive Wistar strain before and after a 30 min incubation in fresh plasma of the Wistar (Wistar and Wistar-W in panel C) and in plasma from WKY and SHR (Wistar-WKY and Wistar-SHR in panel C). For quantitative measurements see (25).

