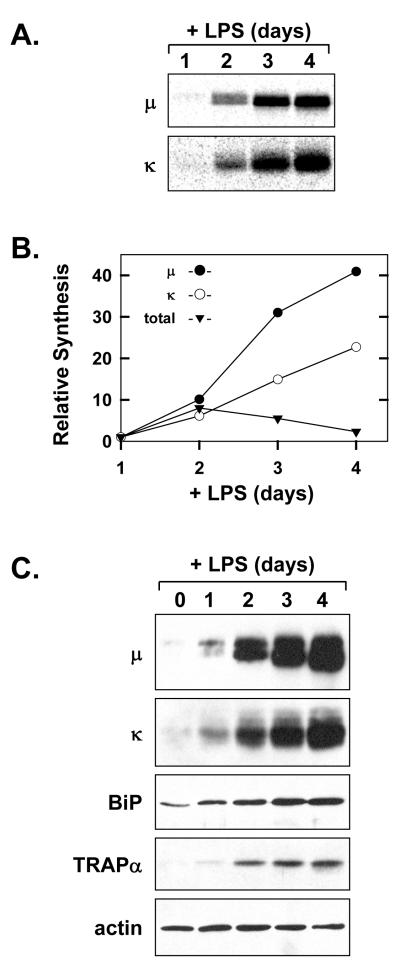
Figure 1.
Induction of Ig synthesis in LPS-stimulated splenic B-cells. Splenic B-cells were cultured in the presence of LPS. A, At the indicated intervals of LPS stimulation, 2×10⁶ viable cells were metabolically labeled with 75μCi/ml [35S]methionine and cysteine for 10 min. Ig μ and κ chains were immunoprecipitated from the cell lysates and resolved by SDS-PAGE under reducing conditions. Signals from the labeled Ig chains were captured by phosphorimaging. B, Synthesis of Ig μ and κ chains at each interval of LPS stimulation was assessed by quantification of the signals shown in A. Total protein synthesis was assessed by TCA precipitation of cell lysates (2.5×10⁵ cells at each interval) from the experiment in A followed by scintillation spectroscopy. The relative level of synthesis is plotted for μ(●), κ(○), and total protein (▼) at each interval as compared to day 1 (set at 1). C, Cell lysates were prepared at the indicated intervals and equal cell equivalents were assessed by immunoblotting for Ig μ and κ chains, the soluble ER chaperone BiP, the ER translocon component TRAPα, and actin as a loading control.

