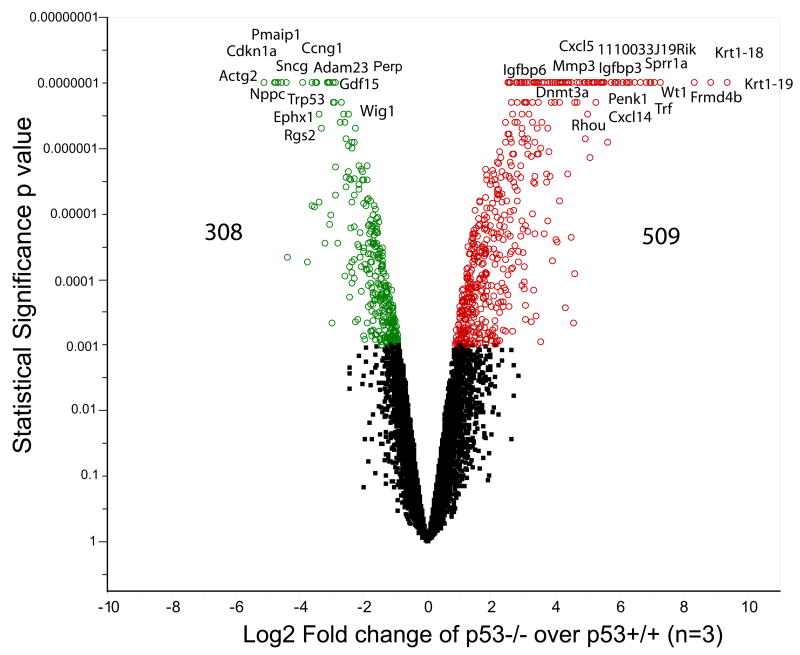
Figure 3. Volcano plot illustrating the differential gene expression between p53+/+ and p53 −/− MEF cells.
A microarray based gene expression analysis was conducted and a randomized variance t test (Wright and Simon, 2003) was used to select the significantly down-regulated genes (green) and the up-regulated genes (red) at p ≤ 0.001 (n = 3). A total of 817 genes were differently expressed in the p53−/− MEFs as compared to the p53+/+ MEFs. In the p53−/− cells there was a significant up-regulation of chemokines and cytokines such as Ccl5, Ccl8, Cxcl5, Cxcl10, Cxcl12, Cxcl14, Cxcl15, Cxcl16 and growth factor genes such as Igf1, Igf2, Fgf18, Fgf9, Fgf13, Fgf21, Gdf5, Bmp2 and Bmp6. Genes involved in the regulation of cell proliferation, cell death and apoptosis such as Bax, Mgmt, p53 (Trp53), p21 (Cdkn1a), Ccng1, Pmaip1 were down-regulated in the p53−/− cells.

