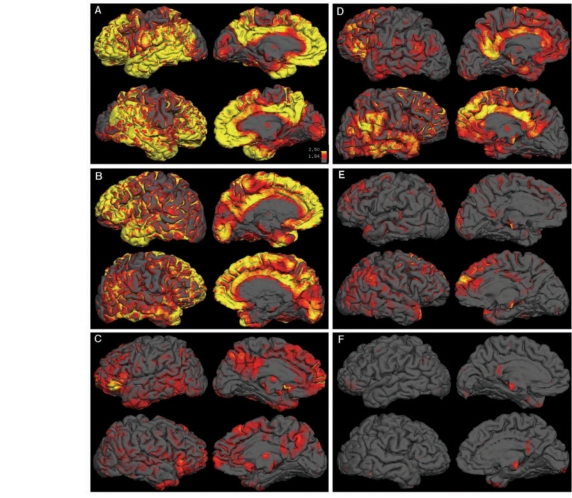
Figure 1.
Qualitative examination of PIB-DVR data. Partial volume corrected PIB-DVR images were overlaid on native space reconstructed surfaces derived from the subject's T1-weighted structural scan for 3 UCSF Alzheimer's disease subjects (A–C) and 3 BAC NC subjects (D–F). Each box shows lateral and medial views of PIB distribution for a single subject (left hemisphere is above right hemisphere in each box). All images reflect the same color scale, with yellow indicating high PIB uptake, red indicating medium PIB uptake, and grey indicating low PIB uptake.

