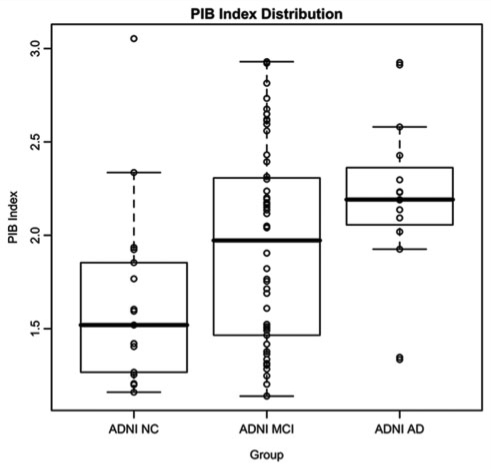
Figure 3.
Box and whiskers plot showing the distribution of SUVR PIB index values in ADNI groups. ADNI SUVR PIB index values are not directly comparable to BAC NC and UCSF Alzheimer's disease DVR PIB index values in Fig. 2 due to differences in image processing (see text).

