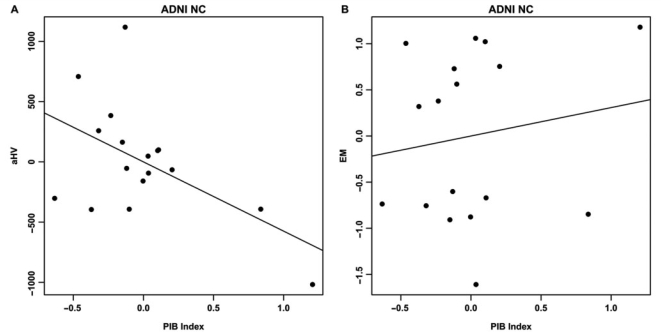
Figure 6.
Partial regression plots showing the relationships between PIB index and aHV (A) and EM (B) within the ADNI NC group. Residuals are plotted for each variable to adjust for the effects of age, gender and education. Only PIB index versus aHV shows a significant association (A: ΔR2 = 0.22, P = 0.047; B: ΔR2 = 0.02, P = 0.60).

