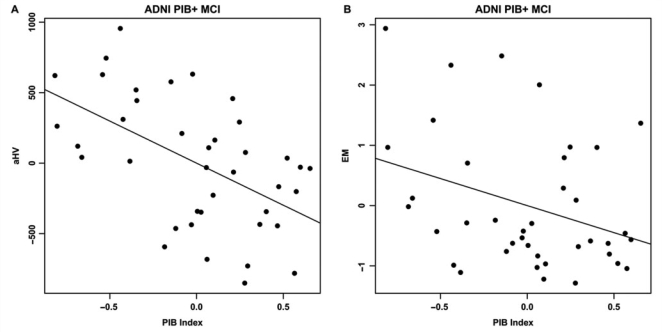
Figure 7.
Partial regression plots showing the relationships between PIB index and aHV (A) and EM (B) within the ADNI PIB+ MCI group. Residuals are plotted for each variable to adjust for the effects of age, gender and education. PIB index is significantly associated with both aHV and EM (A: ΔR2 = 0.27, P = 0.00070; B: ΔR2 = 0.11, P = 0.046).

