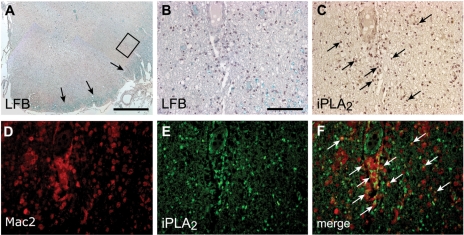
Figure 10.
Expression of iPLA2 in human multiple sclerosis. (A) Ventral funiculus of the spinal cord from a patient with secondary progressive multiple sclerosis stained with Luxol fast blue to visualize myelin which is seen mainly along the periphery of the section (arrows) and counterstained with haematoxylin. Note the loss of myelin in the ventral funiculus. (B and C) Shows higher magnification of the area outlined by the rectangle in panel A. Tissue section stained with Luxol fast blue and hematoxylin (B) and iPLA2 (C). Note the presence of iPLA2 positive cells (arrows in C) in the area of the demyelinated lesion. (D-F) Double-immunofluorescence labelling for Mac-2 (activated macrophages) (D), and iPLA2 (E) from an active lesion. (F) Note in the merged image the presence of activated macrophages expressing iPLA2 (arrows). Scale bars: A = 3 mm, B–F = 100 μm.

