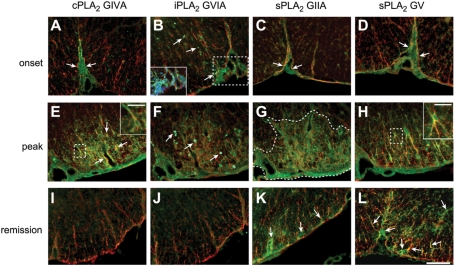
Figure 3.
Micrographs showing the ventral region of the lumbar spinal cord double-labelled with anti-GFAP (red) and anti-PLA2 (green) antibodies. The PLA2 labelling is indicated at the top of each panel. (A–D) Note that at the onset of disease, the expression of all PLA2s is seen in immune cell infiltrates in the submeningeal regions (arrows). The inset in panel B is a higher magnification of the area outlined in the box showing iPLA2 labelling and nuclear labelling (DAPI), indicating the presence of immune cell infiltrates in this region. (E–H) At the peak of disease there is a marked increase in all PLA2s. The co-localization of cPLA2 GIVA and sPLA2 GV in GFAP+ astrocytes is illustrated in the inserts which show higher magnification of the boxed areas in panels E and H. iPLA2 GVIA labelling is very prominent in what appear to be immune cells (arrows in F), while the sPLA2 GIIA labelling is very diffuse in the area outlined by the dashed line in panel G. sPLA2 GV (H) also shows some diffuse labelling in addition to the labelling of astrocytes. (I–L) In the remission stage there is little if any expression of cPLA2 GIVA (I) and iPLA2 GVIA (J) but there is still expression of sPLA2 GIIA and V (K and L). Scale bar = 100 μm. Scale bars in insets = 30 μm.

