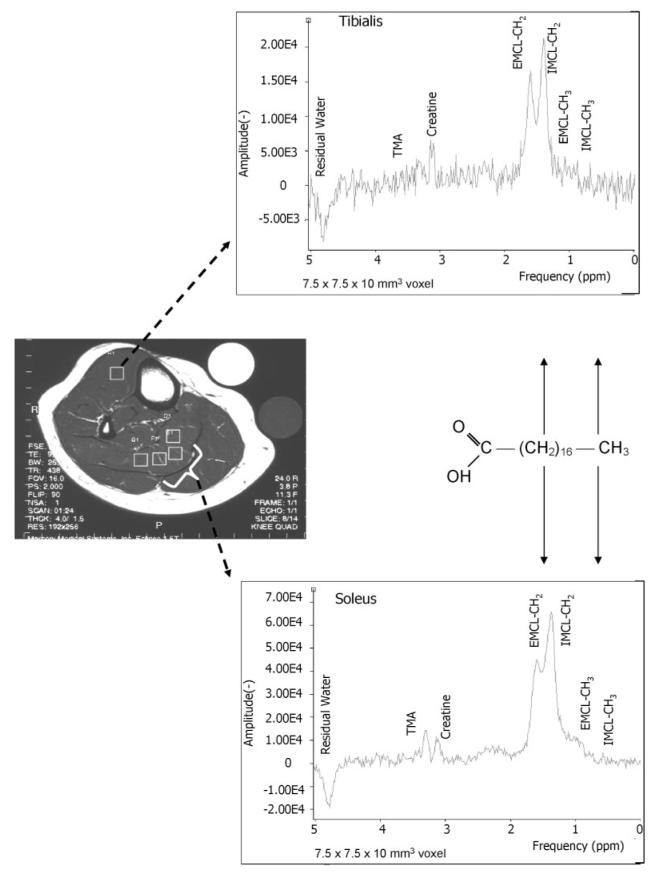
Figure 1.
Water-suppressed PRESS boxes (7.5 × 7.5 × 10 mm3 voxels) were collected from the largest volume of the calf muscle (TE = 35 ms; TR = 2 seconds). The figure shows four possible positions in the soleus and one position in the TA muscle in a cross-sectional scout image (TE = 9.7 ms; TR = 500 ms; field of view = 10 × 7.5 mm). IMCL and EMCL were determined from the average of the sum of three PRESS boxes in the soleus and one to two PRESS boxes in the TA muscles. Typical 1H MRS obtained from a single PRESS box in the soleus and TA muscles is shown. The spectrum shows the CH2 and CH3 peaks of EMCL and IMCL that are shifted in frequency by 0.2 ppm and the residual water trimethyl amine (A) and creatine peaks.

