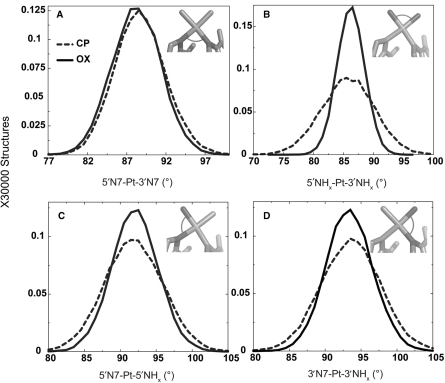
Figure 2.
Geometrical parameters of platinum. The distributions of the four angles around the square-planar platinum atom are plotted from the CP- and OX-TGGA simulations: 5′N7-Pt-3′N7 (A), 5′NHx-Pt-3′NHx (B), 5′N7-Pt-5′NHx (C), 3′N7-Pt-3′NHx (D). The Pt-amines at the 5′ and 3′ side of the adduct are denoted as 5′NHx and 3′NHx, respectively. The N7s of G6 and G7 that are involved in covalent bonds with Pt are denoted as 5′N7 and 3′N7, respectively. The frequency distribution histograms were calculated from the structures obtained at every picosecond over the final 6 ns of each equilibrated MD simulation, resulting in a total of 30 000 structures each for CP-, OX- and undamaged DNA. The distribution is plotted against the number of structures in the trajectory. The frequency distributions for CP- and OX-TGGA adducts are shown as a dashed line and solid line, respectively.

