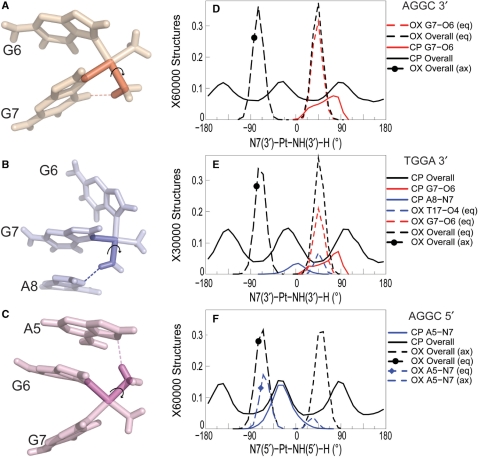
Figure 3.
Dihedral angle involved in hydrogen bond formation. The dihedral angle describing the Pt-amine hydrogen orientation while forming hydrogen bond with adjacent DNA bases is shown for the G7-O6 hydrogen bond in CP-DNA in the AGGC sequence context (A), the A8-N7 hydrogen bond in CP-DNA in the TGGA sequence context (B) and the A5-N7 hydrogen bond in CP-DNA in the AGGC sequence context (C), respectively. OX has two hydrogens for each Pt-amine—equatorial (eq) and axial (ax). The distribution of the 3′N7-Pt-NHx-H dihedral angle is shown for the AGGC sequence context (D) and the TGGA sequence context (E). The distribution of the 5′N7-Pt-NHx-H dihedral angle is shown for the AGGC sequence context (F). The distribution of dihedral angles involving all the structures of an adduct are plotted in black, distribution of dihedral angles for structures with the G7-O6 hydrogen bond are plotted in red and that for structures with the hydrogen bond to adjacent base are plotted in blue. Similarly, distributions for OX-DNA are plotted as a dashed line while those for CP-DNA are plotted as a solid line. The frequency distribution histograms for the overall distributions were calculated from the final 30 000 structures (taken every picosecond) for the TGGA and 60 000 structures for the AGGC sequence contexts, for the CP-, OX- and undamaged DNA simulations as described in Figure 2. [Simulations in the AGGC sequence context were performed from two starting structures each as described in Sharma et al. (26).] The frequency distribution for a particular hydrogen bonded species was obtained from structures that formed that particular hydrogen bond. However, the normalization was performed over the full 30 000 structures to show the relative abundance of different hydrogen bonded species.

