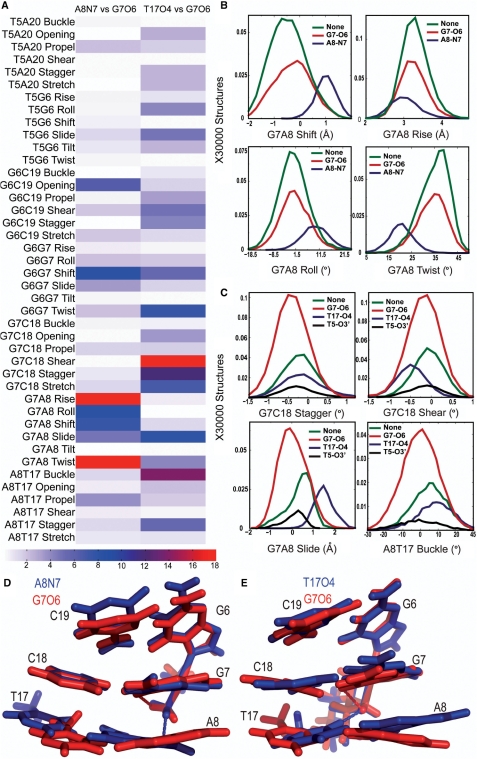
Figure 4.
Helical parameters in the TGGA sequence context. The conformational differences in the central 4 bp for different hydrogen bonded species in the TGGA sequence context are represented at three different levels. The differences between two hydrogen bonded species in all the 42 parameters are shown in a heat map (A). For CP-DNA, we compare structures with G7-O6 hydrogen bond to structures with the A8-N7 hydrogen bond and for OX-DNA we compare structures with G7-O6 hydrogen bond to structures with the T17-O4 hydrogen bond. We represent the differences as the KS ratio, which is color-coded (The KS ratio decreases in the order of Red > Blue > White). Plots of histograms of the four helical parameters showing significant differences for different hydrogen bonded species of CP-DNA adduct (B) and OX-DNA adduct (C), are shown with the frequency distribution calculated as described before. The distribution for structures with no hydrogen bond is plotted in green, for structures with G7-O6 hydrogen bond in plotted in red and for structures with hydrogen bond to the adjacent base is plotted in blue. Alignment of 5′G6G7A8 3′ base pairs of the centroid structures forming the CP-G7-O6 hydrogen bond (red) and the CP-A8-N7 hydrogen bond (blue) (D) are shown. Alignment of 5′G6G7A8 3′ base pairs of the centroid structures forming the OX-G7-O6 hydrogen bond (red) and the OX-T17-O4 hydrogen bond (blue) (E) are also shown. The structures are aligned based on Pt-G6G7.

