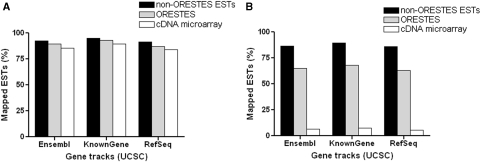
Figure 1.
Mapping of ESTs on the human genome according to three different data sets. (A) ESTs mapped onto human transcript regions. (B) ESTs mapped onto human exonic regions. Black bar, ESTs; gray bar, ORESTES (open reading frame expressed sequence tags); and white bar, ORESTES that compound the cDNA microarray.

