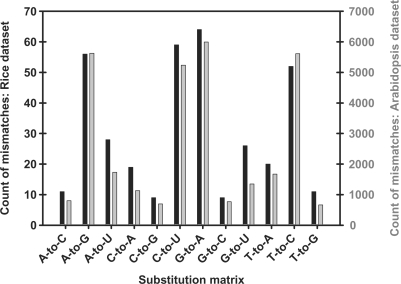
Figure 1.
Histogram displaying the nature of single nucleotide mismatches when comparing of the rice dataset (black bars) and the Arabidopsis dataset (grey bars) to their respective genomes. Substitutions listed on the abscissa are from DNA (genome) to RNA (small RNA sequence). Note that both histograms virtually overlap, despite a discrepancy of 50-fold in the input datasets.

